

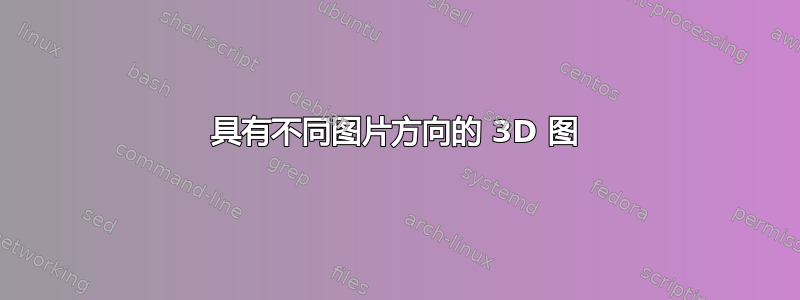
我正在尝试说明 3D 系统,光线从一个垂直表面反射到另一个垂直表面,然后水平反射。我尝试了不同的风格来控制光线的路径和外观,但没有得到清晰的图像。例如,在第一个图中,水平反射表面的方向不正确。希望图像可以清楚地说明我的问题。任何帮助都值得赞赏。
试验一
\documentclass[%
% border=1pt
  border={20pt 40pt 40pt 80pt} % left bottom right top
]{standalone}
\usepackage{tikz,pgfplots}
\usetikzlibrary{intersections,fadings,decorations.pathreplacing} %
\usepgfplotslibrary{patchplots}
\usepackage{xcolor}
\definecolor{Ground}{HTML}{EBF5FB}
\begin{document}

\begin{tikzpicture}
 \tikzset{
        pics/RIS/.style n args={3}{ % numRows, numCols, elementSize
            code={
            \def\numRows{5}
    \def\numCols{5}
    \def\elementSize{0.35}
    \def\gap{0.1}
    \pgfmathsetmacro{\xStart}{#1}
    \pgfmathsetmacro{\yStart}{#2}
    \pgfmathsetmacro{\zStart}{#3} % Adjust zStart for height

    \foreach \row in {1,...,\numRows}{
        \foreach \col in {1,...,\numCols}{
            \pgfmathsetmacro{\xCoord}{\xStart+(\col-1)*(\elementSize+\gap)}
            \pgfmathsetmacro{\yCoord}{\yStart+(\row-1)*(\elementSize+\gap)}
            % Adjust below for the 3D perspective and orientation
            \edef\temp{\noexpand\draw[fill=blue!20!white!30,draw=black] (axis cs:\xCoord,\yCoord,\zStart) -- ++(axis direction cs:\elementSize,0,0) -- ++(axis direction cs:0,\elementSize,0) -- ++(axis direction cs:-\elementSize,0,0) -- cycle;}
            \temp
        }
    }
            }
        }
    };

\tikzset{block/.style={draw, rectangle,                 width=\textwidth, height=1.5*\textwidth,drop shadow}}
\begin{axis}[ clip = false,
                colormap={winter}{
                HTML={EAF2F8}
                HTML={EBF5FB}
                },
                xtick=\empty,
                ytick=\empty,
                ztick=\empty,
                axis line style={draw=none},
                zmin=-10, zmax=70]
    \addplot3[surf,samples=25,x=-0.5:0.5, y=-0.5:0.5] { -0.01*x^2-0.01*y^2 };
    \node[name=GS1] at (axis cs:0,0,16){}
       ;

    \node[name=satone,rotate=-20] at (axis cs:17,17,50){};
    \node[name=sat,rotate=-30] at (axis cs:12,15,120){};


    \node[name=satthree,rotate=-30] at (axis cs:6,15,50){};


     \path(GS1)--++(-120:10pt)--++(47:30pt)node[coordinate,name=A]{};

    \path(satthree.west)--++(80:55pt)--++(0:0pt)node[coordinate,name=B]{};
       \draw[-,dashed](A)--(B);

     \pic[rotate=-45] at (0,0,0) {RIS={-10}{14}{60}};
     \pic[rotate=-45] at (0,0,0) {RIS={-15}{12}{70}};
    \pic[rotate=90,name=RIS1] at (axis cs:12,22,-50) {RIS={0}{0}{0}};
\path(sat.center)--++(0:20pt)node[coordinate,name=A]{};
      \draw[-,thick](A)--++(-3,-10,-9)node[coordinate,name=D]{};

      \node[name=sattwo,rotate=50] at (axis cs:14,18,20){};
      \pic[rotate=45] at (0,0,0) {RIS={10}{-2}{-160}};

     \path(sattwo.center)--++(0:7pt)node[coordinate,name=A]{};
      \draw[-,thick](A)--++(-3,-10,-16)node[coordinate,name=C]{};

       \path(satthree.center)--++(0:20pt)node[coordinate,name=A]{};
       \draw[-,thick](A)--++(-1,-14,2)node[coordinate,name=E]{};
       \path(satthree.center)--++(11.5:20pt)node[coordinate,name=A]{};
       \draw[-,thick](A)--++(-19,15,-95)node[coordinate,name=B]{};


       %Rays
        \path(GS1)--++(-120:10pt)--++(47:30pt)node[coordinate,name=A]{};
        \path[-](D)--++(-9,4.5,-80)node[coordinate,name=D]{};
        \path[-](satone)--++(8:-12pt)node[coordinate,name=satone]{};
       \draw[->,dashed,red](A)--(B)--(D)--(satone.center);


        \path[-](satone)--++(90:-5pt)node[coordinate,name=satone]{};
       \draw[->,dashed,red](A)--(E)--(C)--(satone.center);


\end{axis}


\end{tikzpicture}
\end{document}

第二次试验
\documentclass[%
    % border=1pt
      border={20pt 40pt 40pt 80pt} % left bottom right top
    ]{standalone}
    \usepackage{tikz,pgfplots}
    \usetikzlibrary{intersections,fadings,decorations.pathreplacing} %
    \usepgfplotslibrary{patchplots}
    \usepackage{xcolor}
    \definecolor{Ground}{HTML}{EBF5FB}
    \begin{document}
    \tikzset{
        pics/RIS/.style={ % No arguments needed
            code={
            % Fixed values for number of rows, columns, and element size
            \def\numRows{5}
            \def\numCols{5}
            \def\elementSize{0.5cm}
            \def\gap{0.1cm} % Space between squares
            \foreach \row in {1,...,\numRows}{
                \foreach \col in {1,...,\numCols}{
                    \pgfmathsetmacro{\xCoord}{(\col-1)*(\elementSize+\gap)}
                    \pgfmathsetmacro{\yCoord}{(\row-1)*(\elementSize+\gap)}
                    % Draw squares
                    \draw[fill=blue!20] (\xCoord,\yCoord,0) rectangle ++(\elementSize,\elementSize,0);
                }
            }
            }
        }
    }


    \begin{tikzpicture}
    \tikzset{block/.style={draw, rectangle,                 width=\textwidth, height=1.5*\textwidth,drop shadow}}
    \begin{axis}[ clip = false,
                    colormap={winter}{
                    HTML={EAF2F8}
                    HTML={EBF5FB}
                    },
                    xtick=\empty,
                    view={60}{15},
                    ytick=\empty,
                    ztick=\empty,
                    axis line style={draw=none},
                    zmin=-10, zmax=70]
        \addplot3[surf,samples=25,x=-0.5:0.5, y=-0.5:0.5] { -0.01*x^2-0.01*y^2 };
        \node[name=Startingpoint] at (axis cs:0,0,16){Starting point}
           ;
          \addplot3[mesh, gray!50, domain=-30:30, samples=17, domain y=-30:30, samples y=17] {0};
          \addplot3 [patch, patch refines=4, patch type=rectangle, white, faceted color=red!50 ]  coordinates {(-30,0,8) (30,0,8) (30,0,-8) (-30,0,-8)};
         \pic[rotate=-190] at (axis cs:0,50,70) {RIS};
         \pic[rotate=-45] at (axis cs:0,0,0) {RIS};
         \pic[rotate=90,name=RIS1] at (axis cs:12,22,-50) {RIS};
         \pic[rotate=230,name=RIS3] at (axis cs:0,50,40) {RIS};
         \node[name=Endpoint,rotate=-20] at (axis cs:17,100,50){Endpoint};
         \path(Startingpoint)--++(-120:10pt)--++(47:30pt)node[name=A]{A};
        \draw[-,dashed](A)--(axis cs:0,50,70);
    \end{axis}
    \end{tikzpicture}
    \end{document}