

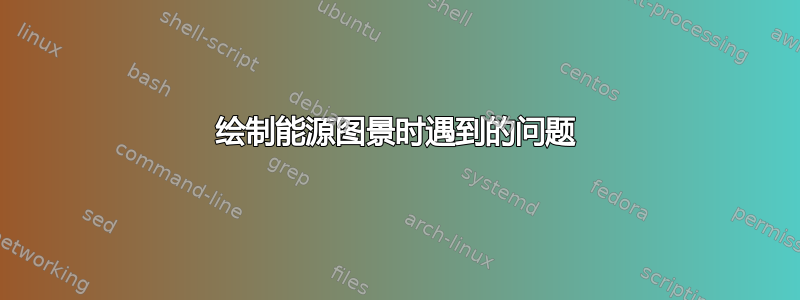
我正在尝试创建如下图所示的图表。
颜色、虚线、圆圈等并不重要。
理想情况下,彼此背后的绘图数量应该容易适应,并且曲线的“形状”应该参数化,例如,它是一个公式而不是硬编码。
具体来说,我的问题在于找到正确的“函数”,绘制一条如图所示的带有 1 个或 2 个孔的曲线,以及如何将它们彼此放置在后面。
编辑:下面提供当前 MWE。

这是我目前的 MWE。我对自己目前所处的困境感到十分惭愧。
\documentclass{article}
\usepackage{pgfplots}
\usetikzlibrary{decorations.pathmorphing, patterns,decorations.pathreplacing, positioning}
\usepgfplotslibrary{fillbetween}
\pgfplotsset{compat = newest}

\begin{document}

\pgfdeclareradialshading{ballshading}{\pgfpoint{-10bp}{10bp}}
 {color(0bp)=(gray!40!white);
 color(9bp)=(gray!75!white);
 color(18bp)=(gray!70!black);
 color(25bp)=(gray!50!black);
 color(50bp)=(black)}

\begin{tikzpicture}
\begin{axis}[restrict y to domain=-5:9.9,
    %axis lines=none
    ]
    \addplot[red,domain=-5:2*pi, samples=200, name path = A]{sin(deg(x))};
    \addplot[red,domain=-5:2*pi, samples=200]{sin(deg(x))+1};
    \addplot[red,domain=-5:2*pi, samples=200]{sin(deg(x))+2};

    \pgfmathsetmacro\valueA{sin(deg(-5))}
    \pgfmathsetmacro\valueB{sin(deg(5))}

        \pgfpathcircle{\pgfpoint{2.1cm}{4cm}}{0.25cm}
  \pgfshadepath{ballshading}{20}
  \pgfusepath{}

    \addplot[name path=B, color=black, thick] coordinates {(-5.01,\valueA) (-5,-1.5) (5, -1.5) (5, \valueB-0.05)};
    \addplot[color=red!10] fill between[of=B and A], soft clip={domain=-5:5}];


\end{axis}
\end{tikzpicture}
\end{document}
产生以下结果:

仍存在多个问题。
- 我怎样才能平移 x 轴上的图表?
- 我该如何正确地绘制之间的填充?5:6 之间有一小块仍然用红色标记
- 如果球被绘制在“填充”区域,它似乎就会消失
- sin 或 sinc 的哪些变化可以帮助我产生更“随机”的景观?
答案1
我认为这pgfplots对于这种图形来说还不够。您可以使用标准tikz和plot对象作为路径的一部分。
以下代码展示了一种可行的方法。我不喜欢“手动”指定每个图的坐标,但这并不难。我过去常常scopes转移每个案例。
\documentclass{article}
\usepackage{tikz}
\usetikzlibrary{scopes}

\begin{document}

\colorlet{myblue}{cyan!70!blue!80!black}
\colorlet{myball}{orange}

\begin{tikzpicture}
{[xshift=-0cm, yshift=-0cm]
  \draw[fill=myblue!60] (0,0) -- (0,1) -- plot[smooth, tension=0.6] coordinates {(0,1)   (1,0.5)  (3,1)   (6,2)} -- (6,0) --cycle;
  \shade[ball color=myball] (1,0.7) circle (0.2);
}

{[xshift=-0.5cm, yshift=-1.1cm]
  \draw[fill=myblue!70] (0,0) -- (0,1.5) -- plot[smooth, tension=0.6] coordinates {(0,1.5)   (1,0.5)  (3,1.2)   (5,1.2)   (6,2)} -- (6,0) --cycle;
  \shade[ball color=myball!30] (1,0.7) circle (0.2);
  \shade[ball color=myball] (4.8,1.4) circle (0.2);
}

{[xshift=-1cm, yshift=-2.2cm]
  \draw[fill=myblue!80] (0,0) -- (0,2) -- plot[smooth, tension=0.6] coordinates {(0,2)   (1,0.7)  (3,1.2)   (5,1.0)   (6,2)} -- (6,0) --cycle;
  \shade[ball color=myball!30] (1.1,0.9) circle (0.2);
  \shade[ball color=myball] (4.8,1.2) circle (0.2);
}

{[xshift=-1.5cm, yshift=-3.3cm]
  \draw[fill=myblue!90] (0,0) -- (0,2) -- plot[smooth, tension=0.6] coordinates {(0,2)   (1,1)  (3,1.2)   (5,0.8)   (6,2)} -- (6,0) --cycle;
  \shade[ball color=myball!30] (1.1,1.18) circle (0.2);
  \shade[ball color=myball] (4.8,1.0) circle (0.2);
}

{[xshift=-2cm, yshift=-4.4cm]
  \draw[fill=myblue] (0,0) -- (0,2) -- plot[smooth, tension=0.6] coordinates {(0,2)   (1,1.3)  (3,1.5)   (5,0.5)   (6,2)} -- (6,0) --cycle;
  \shade[ball color=myball!30] (1.1,1.5) circle (0.2);
  \shade[ball color=myball] (4.9,0.7) circle (0.2);
}

\end{tikzpicture}
\end{document}
结果:
