

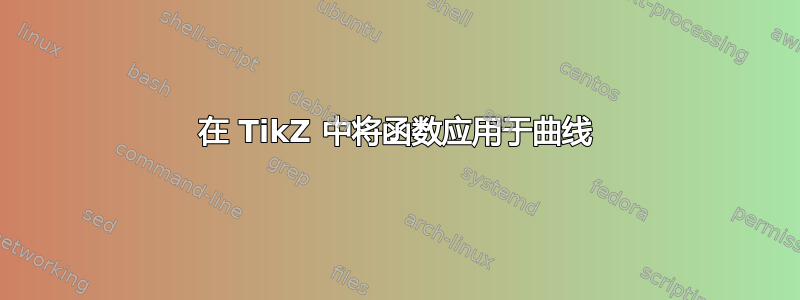
我正在尝试在 TikZ 中复制这张图片

到目前为止,我已经能够在 XY 平面中重新创建所有内容。现在唯一困扰我的是函数本身的图形。域是一个简单的封闭平滑曲线,现在我想将函数应用于此曲线(如果可能的话)以获取图形的轮廓。在 XY 平面上使用坐标网格执行类似操作将解决图形上的线条问题。这对我来说是唯一的概念障碍。这样的事情可能吗?您可以在 TikZ 中将函数应用于曲线吗?目前我的代码包括
\documentclass{standalone}
\usepackage{tikz}
\usetikzlibrary{arrows}
\begin{document}
\begin{tikzpicture}[y={(0.6495cm, 0.375cm)}, x={(0.981cm,-0.191cm)}, z={(0cm, 1cm)}]
\draw[->] (0,0,0) -- (6.3,0,0) node[anchor=west] {$X$};
\draw[->] (0,0,0) -- (0,5.5,0) node[anchor=south west] {$Y$};
\draw[->] (0,0,0) -- (0,0,5) node[anchor=south] {$Z$};
\node[shape=coordinate] (p1) at (3.6,0.7,0) {};
\node[shape=coordinate] (p2) at (2.3,1.4,0) {};
\node[shape=coordinate] (p3) at (1.4,1,0) {};
\node[shape=coordinate] (p4) at (0.9,1.8,0) {};
\node[shape=coordinate] (p5) at (2.1,3.3,0) {};
\node[shape=coordinate] (p6) at (4.65,1.9,0) {};
\filldraw[line width=1pt, fill=lightgray, tension=0.9] plot[smooth cycle] coordinates{(p1) (p2) (p3) (p4) (p5) (p6)};
\end{tikzpicture}
\end{document}
这是当前输出

答案1
这是一个解决方案,我并不完全满意,但它看起来像要求的数字
注意在 foreach 循环和范围中使用全局变量来移动曲线
我没能做到的是从曲线 C1 绘制到曲线 C2,Tikz 无法识别第一个范围内的曲线!
\documentclass{article}
\usepackage{tikz}
\usetikzlibrary{arrows,intersections,calc}
\begin{document}
\begin{tikzpicture}[y={(0.6495cm, 0.375cm)}, x={(0.981cm,-0.191cm)}, z={(0cm, 1cm)}]
\draw[->] (0,0,0) -- (6.3,0,0) node[anchor=west] {$X$};
\draw[->] (0,0,0) -- (0,5.5,0) node[anchor=south west] {$Y$};
\draw[->] (0,0,0) -- (0,0,5) node[anchor=south] {$Z$};
\begin{scope}
\node[shape=coordinate] (p1) at (3.6,0.7,0) {};
\node[shape=coordinate] (p2) at (2.3,1.4,0) {};
\node[shape=coordinate] (p3) at (1.4,1,0) {};
\node[shape=coordinate] (p4) at (0.9,1.8,0) {};
\node[shape=coordinate] (p5) at (2.1,3.3,0) {};
\node[shape=coordinate] (p6) at (4.65,1.9,0) {};
\filldraw[line width=1pt, fill=lightgray, tension=0.9] plot[smooth cycle,,name path global/.expanded=C2] coordinates{(p1) (p2) (p3) (p4) (p5) (p6)};
\end{scope}

\begin{scope}[shift={(0,0,4)}]
\node[shape=coordinate] (p1) at (3.6,0.7,0) {};
\node[shape=coordinate] (p2) at (2.3,1.4,0) {};
\node[shape=coordinate] (p3) at (1.4,1,0) {};
\node[shape=coordinate] (p4) at (0.9,1.8,0) {};
\node[shape=coordinate] (p5) at (2.1,3.3,0) {};
\node[shape=coordinate] (p6) at (4.65,1.9,0) {};
\filldraw[line width=1pt, fill=yellow, tension=0.9,name path global/.expanded=C1] plot[smooth cycle] coordinates{(p1) (p2) (p3) (p4) (p5) (p6)};
\end{scope}

\foreach \xx in {21,26,...,60}{
\path[name path global/.expanded=D\xx] ({\xx/10},0,0) --++(0,0,5);
}

\foreach \xx in {21,26,...,60}{
\path [name intersections/.expanded={of={D\xx} and {C1},by=c\xx}];
\draw[thick,red] (c\xx) --++(0,0,-4);
}


\end{tikzpicture}


\end{document}
