

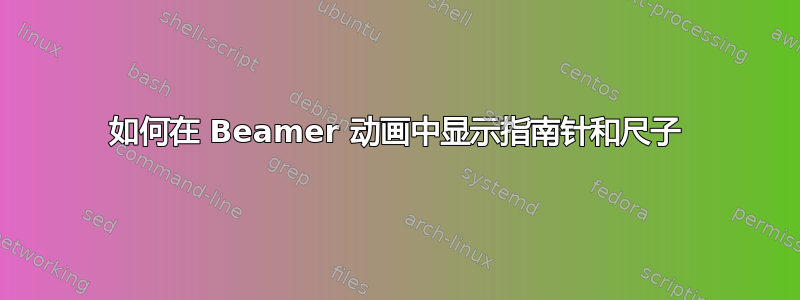
我想在我的投影仪动画中显示一把尺子和一个指南针,与下面的 gif 相同。

这是我的代码:
    \documentclass[dvipsnames,mathserif,fleqn]{beamer}
    \usepackage{tikz,xparse}
    \usetikzlibrary{calc}
    \usetheme{Warsaw}


%%%%%%%%%%%%%%%%%%%%%%%%%%%%%%%%%%%%%%%%%%%%%%%%%%%%%%%%%%%%%%%%%%%%%%%%%%%%%%%%%%%%%%%%%%%%%%%%%%%%%%%%%%%%%%%%%%%
    \newcommand{\NodeAngle}[2]{%
        %\pgfextra{
            \pgfmathanglebetweenpoints%
                {\pgfpointanchor{#1}{center}}%
                {\pgfpointanchor{#2}{center}}%
                \global\let\MyAngle\pgfmathresult
        }%}

        % #1 premier point              ---- Distance entre 2 nodes ----
        % #2 second point
        % On récupère le résultat dans \MyDist
    \makeatletter
    \newcommand{\NodeDist}[2]{%
        \pgfpointdiff{\pgfpointanchor{#1}{center}}
                     {\pgfpointanchor{#2}{center}}
        % no need to use a new dimen
        \pgf@xa=\pgf@x
        \pgf@ya=\pgf@y
        % to convert from pt to cm
        \pgfmathparse{veclen(\pgf@xa,\pgf@ya)/28.45274}
        \global\let\MyDist\pgfmathresult % we need a global macro
    }
    \makeatother

    % ######################
    %     Dessin crayon    #
    % ######################

    \newcommand{\Crayon}[1]{%
        \begin{scope}[scale=.7,#1]
        % Dessin de bois
        \fill[gray!60] (-.2,4.8) -- (.2,4.8)
                    -- (.2,.8) --(.1,.65)
                    -- (0,.8) -- (-.1,.66)
                    -- (-.2,.8) -- cycle ;
        \draw[color=white] (0,4.8) -- (0,.8 );
        \fill[black] (-.2,4.3) -- (0,4.27)
                    -- (.2,4.3) -- (.2,4.8) arc(30:150:0.23cm) ;

        % pointe taillée
        \fill[brown!50] (-.2,.8)
            -- (0,0) node[coordinate,pos=0.75](a){}
            -- (.2,.8) node[coordinate,pos=0.25](b){}
            -- (.1,.65) -- (0,.8) -- (-.1,.66) -- cycle;
        \fill[gray] (a) -- (0,0) -- (b) -- cycle;
        \end{scope}
    }

    \newcommand{\PointeCr}[1]{% pour le compas vu de haut
        \begin{scope}[scale=.7,#1]
        % pointe taillée
        \fill[brown!50] (-.2,.8)
            -- (0,0) node[coordinate,pos=0.75](a){}
            -- (.2,.8) node[coordinate,pos=0.25](b){}
            -- (.1,.65) -- (0,.8) -- (-.1,.66) -- cycle;
        \fill[gray] (a) -- (0,0) -- (b) -- cycle;
        \end{scope}
    }


    % ######################
    %   Dessin du compas   #
    % ######################

    \NewDocumentCommand{\Compas}{smm}{%

        \IfBooleanTF{#1}{%
        % with *
        % keep distance between extemities
        }{%
        % without *
        % calulation of the distance between extremities
        \NodeDist{#2}{#3}
        }

        \NodeAngle{#2}{#3}

        \def\L{6} % taille des branches du compas

        % calcul de l'angle de l'ouverture
        \pgfmathsetmacro{\AngleCP}{asin(\MyDist/(2*\L))}

        \begin{scope}[shift=(#2)]
        \begin{scope}[%
            join=round,
            rotate=\MyAngle,
            shift=(270-\AngleCP:-\L)
            ]

        % branche pointe sèche
        \draw[rotate=-\AngleCP,fill=gray!80]
            (0,0)--(0,-\L)--(-.2,-\L+.8)--(-.2,0)--cycle ;
        \draw[rotate=-\AngleCP,fill=gray!05]
            (0,-\L+.8)--(0,-\L)--(-.2,-\L+.8)--cycle ;

        % branche crayon
        \draw[rotate=\AngleCP,fill=gray!80]
            (0,0)--(0,-\L)--(.2,-\L+.8)--(.2,0)--cycle ;

        \begin{scope}[rotate=\AngleCP,shift={(0,-\L)}]
        \Crayon{rotate=-12}
        \draw[fill=gray!25] (\L/30,\L/5) circle (\L/36) ;
        \fill[gray!5] (\L/30,\L/5)
                -- ++(30:\L/36) arc (30:45:\L/36) -- cycle ;
        \fill[gray!5] (\L/30,\L/5)
                -- ++(210:\L/36) arc (210:225:\L/36) ;
        \filldraw (\L/30,\L/5) circle (.02) ;
        \end{scope}

        % haut du compas
        \draw[fill=gray!80] (-.1,0) rectangle (.1,.7) ;
        \draw[fill=gray!25] (0,0) circle (.25) ;
        \fill[gray!5] (0,0) -- (30:.25) arc (30:45:.25) -- cycle ;
        \fill[gray!5,rotate=180]
            (0,0) -- (30:.25) arc (30:45:.25) -- cycle ;
        \filldraw (0,0) circle (.05) ;
        \end{scope}
        \end{scope}
    }


    \NewDocumentCommand{\CompasH}{smm}{%

        \IfBooleanTF{#1}{%
        % with *
        % keep distance between extemities
        }{%
        % without *
        % calulation of the distance between extremities
        \NodeDist{#2}{#3}
        }

        \NodeAngle{#2}{#3}

    \def\L{6}
    \pgfmathsetmacro{\Scale}{\MyDist/2/\L}

    \begin{scope}[%
        join=round,
        shift=($(#2)!.5!(#3)$),
        rotate=\MyAngle]

    \begin{scope}[xscale=\Scale]
        % branche pointe sèche
        \draw[rotate=-90,fill=gray!80]
            (.1,\L-1) rectangle (-.1,-\L+1) ;
        \draw[rotate=-90,fill=gray!05]
            (.1,-\L+1)--(0,-\L)--(-.1,-\L+1)--cycle ;
    \end{scope}

    \draw[fill=gray!25,rounded corners=2pt]
        (-.4,-.14) rectangle(.4,.14) ;

    \draw[fill=gray!25,rounded corners=2pt]
        (-.3,-.14) rectangle(.3,.14) ;

    \begin{scope}[xscale=\Scale]

        \begin{scope}[shift={(\L,0)}]
            \clip (-1.4,-.17) rectangle (-12,.17) ;
            \Crayon{rotate=90,yscale=1.2}
        \end{scope}

        \begin{scope}[shift={(\L,0)}]
            \clip (-1.4,-.17) rectangle (0.1,.17) ;
            \Crayon{rotate=90,yscale=2}
        \end{scope}

        \draw[draw=gray!50,
            ultra thin,
            fill=gray!15,
            rounded corners=2pt]
            (4.25,-.17) rectangle (4.85,.17) ;

        \draw[ultra thick,
            yshift=-.5pt,
            black!80,
            line cap=round]
            (4.35,-.17)--(4.75,-.17) ;
    \end{scope}

        \filldraw[gray!50!black] (0,0) circle (.08) ;
        \fill[black] (0,0) circle (.2pt) ;

    \end{scope}

    }

    %%%%%%%%%%%%%%%%%%%%%%%%%%%%%%%%%%%%%%%%%%%%%%%%%%%%%%%%%%%%%%%%%%%%%%%%%%%%%%%%%%%%%%%%%%%%%%%%%%%%%%%%%%%%%%%%%%%


    \begin{document}


    \begin{frame}

    \begin{tikzpicture}

    \coordinate (O) at (0:0);
    \coordinate (A) at (200:0);
    \coordinate (B) at (150:1.5);
    \coordinate (C) at (120:1.5);

    \coordinate (D) at (120:1.5);
    \coordinate (E) at (90:1.5);
    \coordinate (F) at (60:1.5);


    \draw[thick] (A)--(B)--(C)--cycle;

    \foreach \i/\lab in {A/below,B/below,C/above}
    {\node[inner sep=2pt,fill,circle,label=\lab:$\i$]at(\i){};}

    \onslide<1-1>{\draw[dashed,very thick] (A) arc [start angle=150, end angle=180, radius=1.5cm];}
    \onslide<1-1>{\Compas{A}{C}}
    \onslide<2-2>{\draw[dashed,very thick] (A) arc [start angle=150, end angle=210, radius=1.5cm];}
    \onslide<2-2>{\Compas{A}{D}}
    \onslide<3->{\draw[dashed,very thick] (A) arc [start angle=150, end angle=240, radius=1.5cm];}
    \onslide<3->{\Compas{A}{E}}

    \end{tikzpicture}
    \end{frame}


    \end{document}