

\begin{center}
\begin{asy}
    unitsize(5cm);
draw(unitcircle, dashed);
    pair A1 = dir(70);
    pair A2 = dir(50);
    pair A3 = dir(10);
    pair A4 = dir(-30);
    pair A5 = dir(-60);
    pair A6 = dir(260);
    pair A7 = dir(240);
    pair A8 = dir(210);
    pair A9 = dir(135);
    label("$1$", A1, dir(A1));
    label("$2$", A2, dir(A2));
    label("$3$", A3, dir(A3));
    label("$4$", A4, dir(A4));
    label("$5$", A5, dir(A5));
    label("$6$", A6, dir(A6));
    label("$7$", A7, dir(A7));
    label("$8$", A8, dir(A8));
    label("$9$", A9, dir(A9));
    pair A = 0.3*dir(50) + 0.4*dir(80);
    pair B = 0.3*dir(50) + 0.4*dir(130);
    pair C = 0.3*dir(50) + 0.4*dir(230);
    pair D = 0.3*dir(50) + 0.4*dir(330);
    pair E = 0.3*dir(50) + 0.4*dir(20);
    \draw(A--B--C--D--E--cycle);
    \draw(A1--A--A2);
    \draw(E--A3);
    \draw(D--A4);
    pair X = B + 0.4 * dir(180);
    pair Y = C + 0.4 * dir(180);
    pair Z = Y + 0.4 * dir(245);
    pair W = D + 0.6 * dir(225);
    draw(X--A9);
    draw(Y--Z--A8);
    draw(Z--A7);
    draw(A6--W--D);
    draw(W--A5);
    draw(B--X--Y--C--W);

    dotfactor *= 2;
    dot(A, mediumgrey);
    dot(B, mediumgrey);
    dot(C, black);
    dot(D, mediumgrey);
    dot(E, black);
    dot(X, black);
    dot(Y, mediumgrey);
    dot(Z, mediumgrey);
    dot(W, black);

\end{asy}
\end{center}

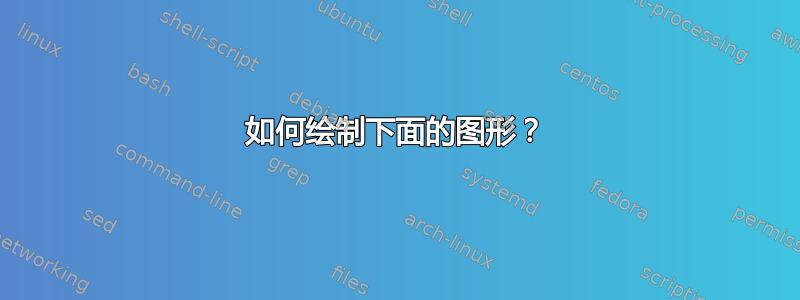
这是 Evan Chen 的讲稿上的照片。
答案1
我更熟悉tikz,这里是一个使用 的解决方案tikz。一些坐标可能不精确,但代码应该相当简单。因此,修改节点非常容易。
结果

节点命名

\documentclass{standalone}
\usepackage[T1]{fontenc}
\usepackage{expl3}
\usepackage{tikz}

\tikzset{
    plainnode/.style={
        inner sep=0pt, outer sep=0pt
    },
    graydot/.style={
        circle, fill=gray!50, minimum size=3pt, plainnode
    },
    blackdot/.style={
        circle, fill=black, minimum size=3pt, plainnode
    }
}

\ExplSyntaxOn

% set the radius of circle
\fp_new:N \l_circle_radius_fp
\fp_set:Nn \l_circle_radius_fp {2.1}
% set how much the text on the circle shifts
\fp_new:N \l_text_shift_fp
\fp_set:Nn \l_text_shift_fp {0.06}

\newcommand*{\drawcircle}{
    \node[dashed, draw, circle, inner~sep=0pt, minimum~size=\fp_eval:n{2.0 * \l_circle_radius_fp}cm] at (0, 0) {};
}

% create a new point at given location
\newcommand*{\newpoint}[4]{
    \node[#3] (#4) at (#1 cm, #2 cm) {};
}

% create a new point on the circle
\newcommand*{\newcircpoint}[3]{
    \fp_set:Nn \l_tmpa_fp {\l_circle_radius_fp*cos(#1 * \c_one_degree_fp)}
    \fp_set:Nn \l_tmpb_fp {\l_circle_radius_fp*sin(#1 * \c_one_degree_fp)}

    % anchor node for connecting lines
    \node[plainnode] (#2) at (\fp_use:N \l_tmpa_fp cm,\fp_use:N \l_tmpb_fp cm) {};

    % text node for displaying number
    \node[plainnode] at (
        \fp_eval:n {(1.0 + \l_text_shift_fp) * \l_tmpa_fp} cm,
        \fp_eval:n {(1.0 + \l_text_shift_fp) * \l_tmpb_fp} cm) {\tiny #3};
}

% draw lines between nodes
\newcommand*{\drawline}[1]{
    \clist_set:Nn \l_tmpa_clist {#1}
    \clist_map_variable:NNn \l_tmpa_clist \l_tmpa_tl {
        \draw (\tl_item:Nn \l_tmpa_tl {1})--(\tl_item:Nn \l_tmpa_tl {2});
    }
}

\ExplSyntaxOff

\begin{document}

\begin{tikzpicture}

\drawcircle

\newpoint{-0.9}{1.2}{blackdot}{A}
\newpoint{-0.1}{1.2}{graydot}{B}
\newpoint{0.6}{1.4}{graydot}{C}
\newpoint{-0.9}{-0.1}{graydot}{D}
\newpoint{-0.1}{-0.1}{blackdot}{E}
\newpoint{1.2}{0.7}{blackdot}{F}
\newpoint{-1.2}{-1.0}{graydot}{G}
\newpoint{0.2}{-0.8}{blackdot}{H}
\newpoint{1.0}{0.0}{graydot}{I}

\newcircpoint{70}{J}{1}
\newcircpoint{55}{K}{2}
\newcircpoint{8}{L}{3}
\newcircpoint{-20}{M}{4}
\newcircpoint{-60}{N}{5}
\newcircpoint{-100}{O}{6}
\newcircpoint{-120}{P}{7}
\newcircpoint{-145}{Q}{8}
\newcircpoint{120}{R}{9}

\drawline{AB, AD, AR, BC, BE, CJ, CK, CF, DE, DG, EI, EH, FI, FL,
    GQ, GP, HO, HN, HI, IM}

\end{tikzpicture}

\end{document}