

嗨,我正在尝试写这个流程图
输入代码:
\documentclass{article}
\usepackage[utf8]{inputenc}
\usepackage{tikz}
\usetikzlibrary{shapes.geometric,arrows}

\tikzstyle{process} = [rectangle, minimum width=3cm, minimum height=1cm, text centered, draw=black, fill=orange!30]
\tikzstyle{decision} = [diamond, minimum width=3cm, minimum height=1cm, text centered, draw=black, fill=green!30]
\tikzstyle{arrow} = [thick,->,>=stealth]

\begin{document}
\begin{figure}

\begin{tikzpicture}[node distance=2cm]
\node(in1)[process]{t=0 };
\node(in2)[decision, below of=in1]{t <valeur };
\node(in3)[process, below of=in2] {Résolution };
\node(in4)[process, below of=in3]{t+dt };

\node(in5)[process, below of=in4] {Résultats };


\draw [arrow] (in1) -- (in2);
\draw [arrow] (in2) -- (in3);
\draw [arrow] (in3) -- (in4);
\draw [arrow] (in4) -- (in1);
\draw [arrow] (in2) -- (in5);


\end{tikzpicture}
\caption{title }
    \label{fig:title}
\end{figure}

\end{document}

答案1
这样更好

\documentclass{article}
\usepackage[utf8]{inputenc}
\usepackage{tikz}
\usetikzlibrary{calc, shapes.geometric,arrows,positioning, fit}

\tikzstyle{process} = [rectangle, minimum width=3cm, minimum height=1cm, text centered, draw=black, fill=orange!30]
\tikzstyle{decision} = [diamond, minimum width=3cm, minimum height=1cm, text centered, draw=black, fill=green!30]
\tikzstyle{arrow} = [thick,->,>=stealth]

\begin{document}
\begin{figure}
\centering
\begin{tikzpicture}[]
\node(in1)[process]{t=0 };
\node(in2)[decision, below=of in1]{t <valeur };
\node(in3)[process, below=of in2] {Résolution };
\node(in4)[process, below=of in3]{t+dt };
\node(in5)[process, below=of in4] {Résultats };
\coordinate (a) at ($(in1)!0.4!(in2)$);
\coordinate (b) at ($(in4)!0.5!(in5)$);

\draw [arrow] (in1) -- ++(0,1) -- (in1);
\draw [arrow] (in1) -- (in2);
\draw [arrow] (in2) -- node[left]{yes} (in3);
\draw [arrow] (in3) -- (in4);
\draw [arrow] (in4) -- ++(0,-0.75) -- ++(-3,0) |- node[pos=0.05]{branch} node[above]{eti A :} (a);
\draw [arrow] (in2) -- node[below]{no} node[above]{branch} ++(3,0) |- (b) -- node[left=1.5cm, yshift=-3pt]{eti B :} (in5);

\node[draw, ultra thick, dashed, fit={($(in1.north)+(-4cm,0.25cm)$)($(b)+(4cm,0)$)}, ] {};

\end{tikzpicture}
\caption{title }
    \label{fig:title}
\end{figure}

\end{document}
答案2
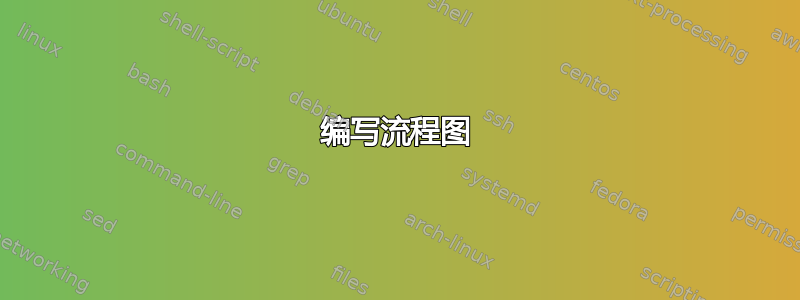
替代:

通过使用 Ti钾Z 库chains和用于定义图像元素样式的最新语法:
\documentclass[border=3mm]{standalone}
\usepackage{tikz}
\usetikzlibrary{arrows.meta,
                chains,
                fit,
                positioning,
                shapes.geometric}


\begin{document}
    \begin{tikzpicture}[
              > = Stealth,
  node distance = 4mm,
    start chain = going below,
 process/.style = {draw, fill=orange!30,
                   minimum width=3cm, minimum height=1cm, align=center},
decision/.style = {diamond, aspect=1.5, draw, fill=green!30,
                   minimum width=3cm, align=center},
every edge/.append style = {->},
    FIT/.style = {draw, dashed, semithick, fit=#1}
                        ]
    \begin{scope}[nodes={on chain}]
\coordinate (in);
\node (in1) [process]   {$t = 0$};
\coordinate (aux1);
\node (in2) [decision]  {$t < \mathit{valeur}$};
\node (in3) [process]   {Résolution };
\node (in4) [process]   {$t+dt$};
\coordinate (aux2);
\coordinate (aux3);
\node (in5) [process]   {Résultats};
    \end{scope}
% arrows
\draw   (in)    edge (in1)
        (in1)   edge (in2)
        (in2)   edge node[right] {oui}  (in3)
        (in3)   edge (in4);
\draw[->]   (in4)   -- (aux2)
                -- node[below] {Branchement} ++ (-3,0)
                |- node[above] (aux4) {Etiquette A:} (aux1);
\draw   (in2.east) -- node[below] {non}
                      node[above right] (aux5) {Branchement} ++ (1,0)
                   |- (aux3)
                   edge (in5);

\node (fit) [FIT=(in) (aux3) (aux4) (aux5)] {};
\node [below left] at (fit.north east) {La boucle "pour" (for)};
\node [left] at (in5.north west) {Etiquette B};
    \end{tikzpicture}
\end{document}
答案3
另一个解决方案,带有pstricks, eqparbox一个简单的tabular环境:
\documentclass[pdf, svgnames]{article}
\usepackage{array, eqparbox}
\usepackage{pst-node}%
\usepackage{sansmath}

\newcommand{\eqcolorbox}[2]{\psDefBoxNodes{#1}{\fcolorbox{black}{Bisque}{\eqmakebox[Fr]{#2\strut}}}}

\begin{document}

\sffamily\sansmath
\renewcommand{\arraystretch}{4}
\psset{fillstyle=solid, fillcolor = Bisque, arrowinset=0.12,linejoin=1}
\begin{tabular}{c}
\pnode{T} \\
  \eqcolorbox{Fr1}{$i = 0$} \\
   \dianode[fillcolor=Lime!30]{L}{$ i < 3$} \\
  \eqcolorbox{Fr2}{afficher $(i )$} \\
  \eqcolorbox{Fr3}{$i ++$\strut} \\[2.5em]
  \eqcolorbox{Ins}{Instruction\_après}
\ncline{->}{T}{Fr1:tC}
\ncline{->}{Fr1:bC}{L} \ncput{\pnode[0,-1ex]{A}}
\ncline{->}{L}{Fr2:tC}\nbput{oui}
\ncline{->}{Fr2:bC}{Fr3:tC}
\end{tabular}
\ncangles[angleA=-90, angleB=180, armA=0.6cm, armB=2.6cm, fillstyle=none]{->}{Fr3:bC}{A} \uput{1.25cm}[170](A){\itshape Étiquette A : }\uput{0.2cm}[210](Fr3:bl){\itshape Branchement}
\ncangles[angleB=90, armA=1.2cm, armB=0.8cm, nodesepA=-1pt, fillstyle=none]{->}{L}{Ins:tC}
\nbput[npos=0.25]{ non} \naput[npos=0.6]{\itshape\qquad Branchement}
\uput{1cm}[170](Ins:tC){\pnode[-1.5cm, 0.4cm]{Y}\itshape Étiquette B : }
\pnode[-1.6em, 0](Fr1:tr){X}
\rput[bl](X){\itshape\bfseries La boucle «\,pour\,» (for) \pnode[0,2ex]{Z}}
\psframe[linestyle=dashed, fillstyle=none](Y)(Z)

\end{document}
