

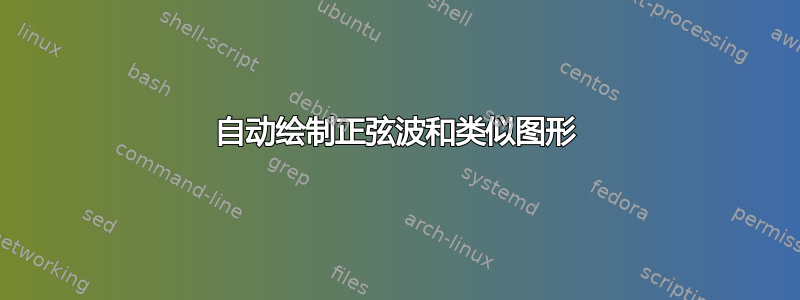
我使用以下代码绘制了一些图形。在此示例中,为正弦波。
如何修改代码以表示
(前一个 x + 一个值,前一个 y + 一个值)
而不是在每个位置重复手动定义 x,y 坐标?
\documentclass{article}
\usepackage{tikz}
\begin{document}
\begin{tikzpicture}[scale=.5, transform shape]
\draw[ultra thick,red,x=0.5cm,y=1cm] (0,0)
 sin (1,1) cos (2,0) sin (3,-1) cos (4,0)
 sin (5,1) cos (6,0) sin (7,-1) cos (8,0)
 sin (9,1) cos (10,0) sin (11,-1) cos (12,0)
 sin (13,1) cos (14,0) sin (15,-1) cos (16,0)
 sin (17,1) cos (18,0) sin (19,-1) cos (20,0)
 sin (21,1) cos (22,0) sin (23,-1) cos (24,0)
 sin (25,1) cos (26,0) sin (27,-1) cos (28,0)
 sin (29,1) cos (30,0) sin (31,-1) cos (32,0);
\end{tikzpicture}
\vskip 1cm
\begin{tikzpicture}[scale=.5, transform shape]
\draw[ultra thick,blue,x=0.5cm,y=1cm] (0,0)
 sin (1,1) cos (2,0) sin (3,-1) cos (4,0)
 sin (5,2) cos (6,0) sin (7,-2) cos (8,0)
 sin (9,3) cos (10,0) sin (11,-3) cos (12,0)
 sin (13,4) cos (14,0) sin (15,-4) cos (16,0)
 sin (17,5) cos (18,0) sin (19,-5) cos (20,0)
 sin (21,6) cos (22,0) sin (23,-6) cos (24,0)
 sin (25,7) cos (26,0) sin (27,-7) cos (28,0)
 sin (29,8) cos (30,0) sin (31,-8) cos (32,0)
 sin (33,7) cos (34,0) sin (35,-7) cos (36,0)
 sin (37,6) cos (38,0) sin (39,-6) cos (40,0)
 sin (41,5) cos (42,0) sin (43,-5) cos (44,0)
 sin (45,4) cos (46,0) sin (47,-4) cos (48,0)
 sin (49,3) cos (50,0) sin (51,-3) cos (52,0)
 sin (53,2) cos (54,0) sin (55,-2) cos (56,0);
\end{tikzpicture}
\end{document}

答案1

编辑:
- 在我看来,按照如下示例所示,使用一些通用的可扩展的“构建框”来组合(平滑)函数是死路一条……构建几个框之后,你将会遇到很多问题,现在这些问题是看不见的,例如如何在平滑函数中连接它们。
- 更好的方法是使用
plot函数,并定义函数及其定义域。例如:
\documentclass{article}
\usepackage{tikz}


\begin{document}
    \begin{tikzpicture}[
trig format=rad,
ultra thick, red,
domain=-8*pi:8*pi,
samples=601             ]
%
\draw   plot (\x/4, {sin(2*\x)});
    \end{tikzpicture}

\bigskip
    \begin{tikzpicture}[
trig format=rad,
ultra thick, blue,
domain=-8*pi:0,
samples=801             ]
%
\draw   plot (\x/4,{((8*pi-abs(\x))/(2*pi))*sin(2*\x)});
    \end{tikzpicture}

\bigskip
    \begin{tikzpicture}[
trig format=rad,
ultra thick, blue,
domain=-8*pi:8*pi,
samples=801             ]
%
\draw   plot (\x/4,{(sin(\x/4))*(sin(4*\x))});
    \end{tikzpicture}
\end{document}
附录(1):
如果你坚持使用按某种链顺序排列的功能块,你可以将块定义为可扩展的“boulding boxes”(BB),然后使用某种循环或chains库将它们定位在图像中。
这就是你所追求的吗?
按循环排序的简单 BB 链示例:
\documentclass{article}
\usepackage{tikz}

\begin{document}
    \begin{tikzpicture}[
BB/.style = {draw=teal, fill=teal!30,
             minimum width=1cm, minimum height=\h cm,
            }
                        ]
\foreach \i in {-3, -2,...,3}
{
\pgfmathsetmacro{\h}{int(3-abs(\i))}        % calculation of function
    \node[BB=\h] at (\i,0) {$\i$};
}
    \end{tikzpicture}
\end{document}

附录(2):
再举一个例子,使用“chains”库:
\documentclass{article}
\usepackage{xifthen}
\usepackage{tikz}
\usetikzlibrary{chains}

\begin{document}
    \begin{tikzpicture}[
node distance=0pt,
  start chain = going right,
BB+/.style = {on chain,
             minimum width=1cm, minimum height=\h cm,
    append after command={\pgfextra{\let\LN\tikzlastnode
                          \draw[ultra thick,line join=round,line cap=round,red]
                                (\LN.west) -- (\LN.north) -- (\LN.east);}% end \pgfextra
                         }% end append after command
            },
BB-/.style = {on chain,
             minimum width=1cm, minimum height=\h cm,
    append after command={\pgfextra{\let\LN\tikzlastnode
                          \draw[ultra thick,line join=round,line cap=roundred,blue]
                                (\LN.west) -- (\LN.south) -- (\LN.east);}% end \pgfextra
                         }% end append after command
            }
                        ]
\foreach \i in {-3, -2,...,3}
{
\pgfmathsetmacro{\h}{2*int(3-abs(\i))}        % calculation of function
\ifthenelse{\isodd{\i}}
        {\node[BB+] {};}
        {\node[BB-] {};}
}
    \end{tikzpicture}
\end{document}

答案2
我不确定你在你的例子中到底做了什么,但原则上这种事情可以使用 pgf 来自动完成\foreach(使用 tikz 时自动可用)。
但是,通常你会使用该\draw plot命令在 TikZ 内部绘制内容,或者 - 如果你想要一个“正确”的绘图 - 只需首先跳到使用 pgfplots:
\documentclass{minimal}

\usepackage{tikz}
\usepackage{pgfplots}

\begin{document}
    \begin{tikzpicture}[scale=.5, x=0.5cm, y=1cm, ultra thick, red]
        \draw (0,0)
            \foreach \x in {0,4,...,28}{
                sin ({1 + \x}, 1) cos ({2 + \x}, 0) sin ({3 + \x}, -1) cos ({4 + \x},0)
            }
        ;
    \end{tikzpicture}
    \end{tikzpicture}

    \begin{tikzpicture}
        \draw[domain=0:12,samples=100] plot ({\x}, {sin(deg(\x))})     ;
    \end{tikzpicture}

    \begin{tikzpicture}
        \begin{axis}
            \addplot[samples=100] {sin(deg(x))};
        \end{axis}
    \end{tikzpicture}
\end{document}
答案3
受到 Qrrbrbirlbel 代码的启发,我想出了这个解决方案;它可以用于根据需要缩放正弦波。
\documentclass[12pt,a4paper]{article}
\usepackage{tikz}
\begin{document}
\pgfmathsetmacro{\xinc}{1.}
\pgfmathsetmacro{\yinc}{1.5}
\begin{tikzpicture}[scale=.5, transform shape]
\draw[ultra thick,red,x=0.5cm,y=1cm] (0,0)
 sin ++(\xinc,\yinc) cos ++(\xinc,-\yinc) sin ++(\xinc,-\yinc) cos ++(\xinc,\yinc)
 sin ++(\xinc,\yinc) cos ++(\xinc,-\yinc) sin ++(\xinc,-\yinc) cos ++(\xinc,\yinc)
 sin ++(\xinc,\yinc) cos ++(\xinc,-\yinc) sin ++(\xinc,-\yinc) cos ++(\xinc,\yinc)
 sin ++(\xinc,\yinc) cos ++(\xinc,-\yinc) sin ++(\xinc,-\yinc) cos ++(\xinc,\yinc)
 sin ++(\xinc,\yinc) cos ++(\xinc,-\yinc) sin ++(\xinc,-\yinc) cos ++(\xinc,\yinc)
 sin ++(\xinc,\yinc) cos ++(\xinc,-\yinc) sin ++(\xinc,-\yinc) cos ++(\xinc,\yinc)
 sin ++(\xinc,\yinc) cos ++(\xinc,-\yinc) sin ++(\xinc,-\yinc) cos ++(\xinc,\yinc)
 sin ++(\xinc,\yinc) cos ++(\xinc,-\yinc) sin ++(\xinc,-\yinc) cos ++(\xinc,\yinc)
 sin ++(\xinc,\yinc) cos ++(\xinc,-\yinc) sin ++(\xinc,-\yinc) cos ++(\xinc,\yinc)
 sin ++(\xinc,\yinc) cos ++(\xinc,-\yinc) sin ++(\xinc,-\yinc) cos ++(\xinc,\yinc)
 sin ++(\xinc,\yinc) cos ++(\xinc,-\yinc) sin ++(\xinc,-\yinc) cos ++(\xinc,\yinc)
 sin ++(\xinc,\yinc) cos ++(\xinc,-\yinc) sin ++(\xinc,-\yinc) cos ++(\xinc,\yinc)
 sin ++(\xinc,\yinc) cos ++(\xinc,-\yinc) sin ++(\xinc,-\yinc) cos ++(\xinc,\yinc)
 sin ++(\xinc,\yinc) cos ++(\xinc,-\yinc) sin ++(\xinc,-\yinc) cos ++(\xinc,\yinc)
;
\end{tikzpicture}
\vskip 1cm
\begin{tikzpicture}[scale=.5, transform shape]
\draw[ultra thick,blue,x=0.5cm,y=1cm] (0,0)
 sin ++(\xinc,\yinc*1) cos ++(\xinc,-\yinc*1) sin ++(\xinc,-\yinc*1) cos ++(\xinc,\yinc*1)
 sin ++(\xinc,\yinc*2) cos ++(\xinc,-\yinc*2) sin ++(\xinc,-\yinc*2) cos ++(\xinc,\yinc*2)
 sin ++(\xinc,\yinc*3) cos ++(\xinc,-\yinc*3) sin ++(\xinc,-\yinc*3) cos ++(\xinc,\yinc*3)
 sin ++(\xinc,\yinc*4) cos ++(\xinc,-\yinc*4) sin ++(\xinc,-\yinc*4) cos ++(\xinc,\yinc*4)
 sin ++(\xinc,\yinc*5) cos ++(\xinc,-\yinc*5) sin ++(\xinc,-\yinc*5) cos ++(\xinc,\yinc*5)
 sin ++(\xinc,\yinc*6) cos ++(\xinc,-\yinc*6) sin ++(\xinc,-\yinc*6) cos ++(\xinc,\yinc*6)
 sin ++(\xinc,\yinc*7) cos ++(\xinc,-\yinc*7) sin ++(\xinc,-\yinc*7) cos ++(\xinc,\yinc*7)
 sin ++(\xinc,\yinc*8) cos ++(\xinc,-\yinc*8) sin ++(\xinc,-\yinc*8) cos ++(\xinc,\yinc*8)
 sin ++(\xinc,\yinc*7) cos ++(\xinc,-\yinc*7) sin ++(\xinc,-\yinc*7) cos ++(\xinc,\yinc*7)
 sin ++(\xinc,\yinc*6) cos ++(\xinc,-\yinc*6) sin ++(\xinc,-\yinc*6) cos ++(\xinc,\yinc*6)
 sin ++(\xinc,\yinc*5) cos ++(\xinc,-\yinc*5) sin ++(\xinc,-\yinc*5) cos ++(\xinc,\yinc*5)
 sin ++(\xinc,\yinc*4) cos ++(\xinc,-\yinc*4) sin ++(\xinc,-\yinc*4) cos ++(\xinc,\yinc*4)
 sin ++(\xinc,\yinc*3) cos ++(\xinc,-\yinc*3) sin ++(\xinc,-\yinc*3) cos ++(\xinc,\yinc*3)
 sin ++(\xinc,\yinc*2) cos ++(\xinc,-\yinc*2) sin ++(\xinc,-\yinc*2) cos ++(\xinc,\yinc*2)
 sin ++(\xinc,\yinc*1) cos ++(\xinc,-\yinc*1) sin ++(\xinc,-\yinc*1) cos ++(\xinc,\yinc*1)
;
\end{tikzpicture}
\end{document}
