

我在用着情节神经网络(使用稍微修改过的 Python 代码) 为我的神经网络架构生成 TikZ 代码。目前,它生成此 TikZ 代码 (它是我的完整网络架构的简化版本,但它可以说明我的问题):
\documentclass[border=8pt, multi, tikz]{standalone}
\usepackage{import}
\subimport{../layers/}{init}
\usetikzlibrary{positioning}
\usetikzlibrary{3d} %for including external image

\def\ConvColor{rgb:yellow,5;red,2.5;white,5}
\def\ConvReluColor{rgb:yellow,5;red,5;white,5}
\def\PoolColor{rgb:red,1;black,0.3}
\def\UnpoolColor{rgb:blue,2;green,1;black,0.3}
\def\FcColor{rgb:blue,5;red,2.5;white,5}
\def\FcReluColor{rgb:blue,5;red,5;white,4}
\def\SoftmaxColor{rgb:magenta,5;black,7}
\def\SumColor{rgb:blue,5;green,15}

\newcommand{\copymidarrow}{\tikz \draw[-Stealth,line width=0.8mm,draw={rgb:blue,4;red,1;green,1;black,3}] (-0.3,0) -- ++(0.3,0);}

\begin{document}
\begin{tikzpicture}
\tikzstyle{connection}=[ultra thick,every node/.style={sloped,allow upside down},draw=\edgecolor,opacity=0.7]
\tikzstyle{copyconnection}=[ultra thick,every node/.style={sloped,allow upside down},draw={rgb:blue,4;red,1;green,1;black,3},opacity=0.7]

\pic[shift={(0,0,0)}] at (0,0,0)
    {Box={
        name=input,
        caption=ERA-5,
        xlabel={{20, }},
        ylabel=222,
        zlabel={{\qquad\qquad\qquad 531}},
        fill=white,
        height=8.88,
        width=0.8,
        depth=21.240000000000002
        }
    };

\node[canvas is zy plane at x=0, xscale=-1] (inputimage) at (0.16000000000000003,0,0) {\includegraphics[width=4.248cm,height=1.7760000000000002cm]{../images/ERA-5.png}};

\pic[shift={(2.16,0,0)}] at (0,0,0)
    {Box={
        name=dil1,
        caption= ,
        xlabel={{50, }},
        ylabel=222,
        zlabel={{\qquad\qquad\qquad 531}},
        fill={rgb:green,5;red,2.5;white,5},
        height=8.88,
        width=2.0,
        depth=21.240000000000002
        }
    };

\draw [connection]  (input-east)    -- node {\midarrow} (dil1-west);

\pic[shift={(5.5600000000000005,0,0)}] at (0,0,0)
    {Box={
        name=output,
        caption=Temperature distribution parameters,
        xlabel={{2, }},
        ylabel=444,
        zlabel={{\qquad\qquad\qquad 444}},
        fill=white,
        height=42.76,
        width=0.08,
        depth=42.76
        }
    };

\draw [connection]  (dil1-east)    -- node {\midarrow} (output-west);

\node[canvas is zy plane at x=0, xscale=-1] (output) at (5.5760000000000005,0,0) {\includegraphics[width=8.552cm,height=8.552cm]{../images/Predicted.png}};

\end{tikzpicture}
\end{document}
这是Box.sty来自图层PlotNeuralNet 存储库中的文件夹:
\ProvidesPackage{Box}

%%%%%%%%%%%%%%%%%%%%%%%%%%%%%%%%%%%%%%%%%%%%%%%%%%%%%%%%%%%%%%%%%%%%%%%%%%%%%%%%%%%%%%
% This Block can draw simple block of boxes with custom colors.
% Can be used for conv, deconv etc
%%%%%%%%%%%%%%%%%%%%%%%%%%%%%%%%%%%%%%%%%%%%%%%%%%%%%%%%%%%%%%%%%%%%%%%%%%%%%%%%%%%%%%
\tikzset{Box/.pic={\tikzset{/boxblock/.cd,#1}
        \tikzstyle{box}=[every edge/.append style={pic actions, densely dashed, opacity=.7},fill opacity=\opacity, pic actions,fill=\fill]

        \pgfmathsetmacro{\y}{\cubey*\scale}
        \pgfmathsetmacro{\z}{\cubez*\scale}

        %Multiple concatenated boxes
        \foreach[count=\i,%
                 evaluate=\i as \xlabel using {array({\boxlabels},\i-1)},%
                 evaluate=\unscaledx as \k using {\unscaledx*\scale+\prev}, remember=\k as \prev (initially 0)]
                 \unscaledx in \cubex
        {
            \pgfmathsetmacro{\x}{\unscaledx*\scale}
            \coordinate (a) at (\k-\x , \y/2 , \z/2);
            \coordinate (b) at (\k-\x ,-\y/2 , \z/2);
            \coordinate (c) at (\k    ,-\y/2 , \z/2);
            \coordinate (d) at (\k    , \y/2 , \z/2);
            \coordinate (e) at (\k    , \y/2 ,-\z/2);
            \coordinate (f) at (\k    ,-\y/2 ,-\z/2);
            \coordinate (g) at (\k-\x ,-\y/2 ,-\z/2);
            \coordinate (h) at (\k-\x , \y/2 ,-\z/2);

            \draw [box]
                (d) -- (a) -- (b) -- (c) -- cycle
                (d) -- (a) -- (h) -- (e) -- cycle
                %dotted edges
                (f) edge (g)
                (b) edge (g)
                (h) edge (g)
            ;
            \path (b) edge ["\xlabel"',midway] (c);

            \xdef\LastEastx{\k} %\k persists as \LastEastx after loop
        }%Loop ends
        \draw [box] (d) -- (e) -- (f) -- (c) -- cycle; %East face of last box

        \coordinate (a1) at (0 , \y/2 , \z/2);
        \coordinate (b1) at (0 ,-\y/2 , \z/2);
        \tikzstyle{depthlabel}=[pos=0,text width=14*\z,text centered,sloped]

        \path (c) edge ["\small\zlabel"',depthlabel](f); %depth label
        \path (b1) edge ["\ylabel",midway] (a1);  %height label


        \tikzstyle{captionlabel}=[text width=15*\LastEastx/\scale,text centered]
        \path (\LastEastx/2,-\y/2,+\z/2) + (0,-25pt) coordinate (cap)
        edge ["\textcolor{black}{ \bf \caption}"',captionlabel](cap) ; %Block caption/pic object label

        %Define nodes to be used outside on the pic object
        \coordinate (\name-west)   at (0,0,0) ;
        \coordinate (\name-east)   at (\LastEastx, 0,0) ;
        \coordinate (\name-north)  at (\LastEastx/2,\y/2,0);
        \coordinate (\name-south)  at (\LastEastx/2,-\y/2,0);
        \coordinate (\name-anchor) at (\LastEastx/2, 0,0) ;

        \coordinate (\name-near) at (\LastEastx/2,0,\z/2);
        \coordinate (\name-far)  at (\LastEastx/2,0,-\z/2);

        \coordinate (\name-nearwest) at (0,0,\z/2);
        \coordinate (\name-neareast) at (\LastEastx,0,\z/2);
        \coordinate (\name-farwest)  at (0,0,-\z/2);
        \coordinate (\name-fareast)  at (\LastEastx,0,-\z/2);

        \coordinate (\name-northeast) at (\name-north-|\name-east);
        \coordinate (\name-northwest) at (\name-north-|\name-west);
        \coordinate (\name-southeast) at (\name-south-|\name-east);
        \coordinate (\name-southwest) at (\name-south-|\name-west);

        \coordinate (\name-nearnortheast)  at (\LastEastx, \y/2, \z/2);
        \coordinate (\name-farnortheast)   at (\LastEastx, \y/2,-\z/2);
        \coordinate (\name-nearsoutheast)  at (\LastEastx,-\y/2, \z/2);
        \coordinate (\name-farsoutheast)   at (\LastEastx,-\y/2,-\z/2);

        \coordinate (\name-nearnorthwest)  at (0, \y/2, \z/2);
        \coordinate (\name-farnorthwest)   at (0, \y/2,-\z/2);
        \coordinate (\name-nearsouthwest)  at (0,-\y/2, \z/2);
        \coordinate (\name-farsouthwest)   at (0,-\y/2,-\z/2);

    },
    /boxblock/.search also={/tikz},
    /boxblock/.cd,
    width/.store        in=\cubex,
    height/.store       in=\cubey,
    depth/.store        in=\cubez,
    scale/.store        in=\scale,
    xlabel/.store       in=\boxlabels,
    ylabel/.store       in=\ylabel,
    zlabel/.store       in=\zlabel,
    caption/.store      in=\caption,
    name/.store         in=\name,
    fill/.store         in=\fill,
    opacity/.store      in=\opacity,
    fill={rgb:red,5;green,5;blue,5;white,15},
    opacity=0.4,
    width=2,
    height=13,
    depth=15,
    scale=.2,
    xlabel={{"","","","","","","","","",""}},
    ylabel=,
    zlabel=,
    caption=,
    name=,
}
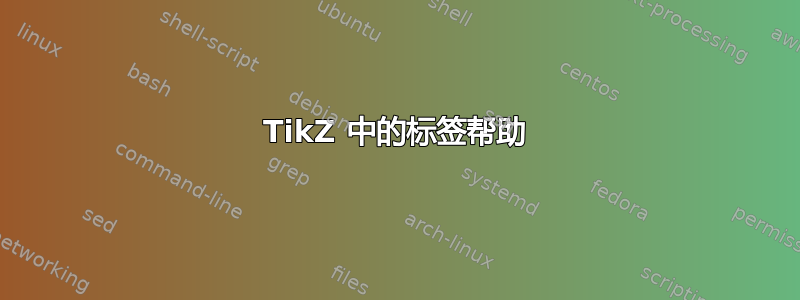
此 LaTeX 代码生成图像

其中有几个与标签相关的事情我想改进:
- 输入层和输出层下的字幕水平空间太小。我想增加这些字幕的水平空间,这样它们就不会占据太多行。
- 我想将其
ylabel逆时针旋转 90 度,并且如果有必要的话,还可以将其沿着盒子边缘稍微向下滑动,滑动距离是每个盒子可以选择的距离。 - 我希望使其
zlabel最终位于框上方而不是框下方,并且更靠近右上角(但不是完全到达角落)。
我如何通过修改生成的 LaTeX 代码以及修改存储库中的 LaTeX 代码来解决这些问题?(实际上,我将通过修改生成它的 Python 代码来间接修改 LaTeX 代码,但这是一个与这个问题并不相关的技术细节。)
答案1
编写 Tikz 代码的方法有很多种。为了演示基本概念,我展示了一个平面二维解决方案,解决了字幕和回转。您可以将其转换为 3D 绘图,这样不会改变这些问题。
我的首选编码风格是将代码分成小步骤,这样更容易理解。当然,你可以一次性完成更多操作,即使用一条\path语句。虽然这可能是有效的编码,但它可能会掩盖相关细节。因此,在某种程度上,方法或理念变成了品味和经验的问题。其他示例肯定会表明这一点。
我建议比较使用生成的 tikz 代码。例如,对于 2D 版本,使用\pics没有多大意义:几乎没有什么可以重复使用。但这只是重构代码的问题。
那么,让我们看一些细节。
\documentclass[10pt,border=3mm,tikz]{standalone}
\usepackage{tikz}
\usepackage{graphicx}
\documentclass[10pt,border=3mm,tikz]{standalone}根据需要调整页面格式。\usepackage{graphicx}我需要导入图形,如下所示。将此绘图保存eur.png在同一目录中以运行我的代码:

\nodes在花括号内显示有效的 Latex 代码。因此,第一个和最后一个包含所述图像,位于给定的坐标处。节点的选项在开头定义,请参阅下面的最终代码。但是,名称应该建议“格式化”图像节点和在中间显示此绿色对象的节点。如果我们需要记住放置节点的位置(就像我们经常做的那样),请使用类似(X)记住位置的语法X。
 % ~~~ objects ~~~~~~~~~~~~~~~~~~~~~~~~~~~~~
    \node[img] (L) at (0,0) {\includegraphics[width=1cm]{eur}};
    \node[grn] (M) at (2,0) {};
    \node[img] (R) at (5,0) {\includegraphics[width=3cm]{eur}};
我有意使用了绝对坐标,这对于像这样的简单绘图来说没问题。此外,从布局者的角度来看,我希望控制对象文本标签的位置;正如您将看到的,选项[txt]负责处理多行文本,您只需\\像在普通 Latex 文本中一样使用即可:
 % ~~~ labels ~~~~~~~~~~~~~~~~~~
    \node[txt] at (0,-2.5) {ERA-5};
    \node[txt] at (5,-2.5) {Temperature distribution\\parameters};
最后,我们需要通过放置更多节点和[nmb]数字选项来设置网络维度。虽然您可以将所有内容与 L、M 和 R 的锚点(即南和西)联系起来,但我发现将它们作为相对于节点中心(L、M 和 R)的绝对坐标放置更方便。
这就是出现 x- 和 yshift 语句以及旋转的原因。文本大小为\tiny,如 style 中指定的那样nmb。
 % ~~~ dimensions ~~~~~~~~~~~~~~~~
    \node[nmb,yshift=-6mm] at (L) {300};
    \node[nmb,xshift=-7mm,rotate=90] at (L) {200};

    \node[nmb,yshift=-6mm] at (M) {300};
    \node[nmb,xshift=-8mm,yshift=-3mm] at (M) {200};

    \node[nmb,yshift=-16mm] at (R) {600};
    \node[nmb,xshift=-18mm,yshift=-3mm,rotate=90] at (R) {400};
为简单起见,我保留了连接箭头的原样。重新设计这些线条、将箭头变成绿色、增加线宽并重新定位箭头并不是什么大问题。同样,您可能从一条\draw语句开始修改,一旦满意,就将这些选项移到具有花哨名称的新样式中,例如arr(未显示)。

\documentclass[10pt,border=3mm,tikz]{standalone}
\usepackage{tikz}
\usepackage{graphicx}

\begin{document}

 \begin{tikzpicture}[
    img/.style={draw,inner sep=.1mm},
    grn/.style={draw,fill=green!25,
                rectangle,minimum height=8mm,minimum width=10mm},
    txt/.style={align=center},
    nmb/.style={font=\tiny},
 ]
 % ~~~ objects ~~~~~~~~~~~~~~~~~~~~~~~~~~~~~
    \node[img] (L) at (0,0) {\includegraphics[width=1cm]{eur}};
    \node[grn] (M) at (2,0) {};
    \node[img] (R) at (5,0) {\includegraphics[width=3cm]{eur}};

 % ~~~ connections ~~~~~~~~~~~~~~~~~~~~~~
    \draw [->] (L) -- (M);
    \draw [->] (M) -- (R);

 % ~~~ labels ~~~~~~~~~~~~~~~~~~
    \node[txt] at (0,-2.5) {ERA-5};
    \node[txt] at (5,-2.5) {Temperature distribution\\parameters};

 % ~~~ dimensions ~~~~~~~~~~~~~~~~
    \node[nmb,yshift=-6mm] at (L) {300};
    \node[nmb,xshift=-7mm,rotate=90] at (L) {200};

    \node[nmb,yshift=-6mm] at (M) {300};
    \node[nmb,xshift=-8mm,yshift=-3mm] at (M) {200};

    \node[nmb,yshift=-16mm] at (R) {600};
    \node[nmb,xshift=-18mm,yshift=-3mm,rotate=90] at (R) {400};

 \end{tikzpicture}

\end{document}