

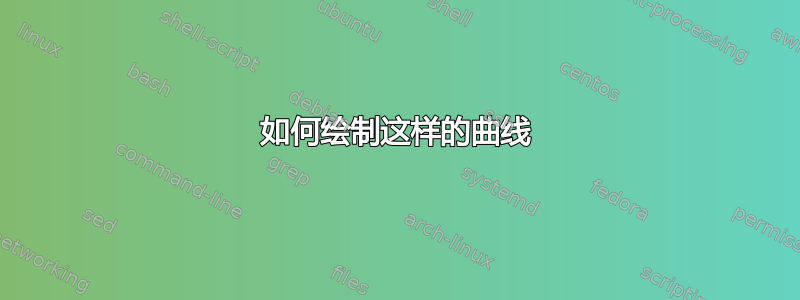
我正在尝试使用 tikz 绘制一条像下图中实心黑色的蜿蜒线。但是,我不知道如何绘制如此复杂的线条。
有人可以提供一些建议吗?
提前致谢!

更新:我关注了这个帖子,TikZ 中的螺旋弹簧,用于生成两个螺旋结构。这是我的代码片段
\documentclass[tikz,12pt]{standalone}

% the code copied from the attached thread
\newcommand\spiral{}% Just for safety so \def won't overwrite something
\def\spiral[#1](#2)(#3:#4:#5){% \spiral[draw options](placement)(end angle:revolutions:final radius)
\pgfmathsetmacro{\domain}{pi*#3/180+#4*2*pi}
\draw [#1,line width=1pt, shift={(#2)}, domain=0:\domain,variable=\t,smooth,samples=int(\domain/0.08)] plot ({\t r}: {#5*\t/\domain})
}

\begin{document}
  \begin{tikzpicture}[scale=1]

    % plot two spirals
    \spiral[black](8,1.6)(0:2:0.6);
    \spiral[black](8,1.6)(0:2:-0.6);
    \spiral[black](6.86, 1.00)(0:1:0.4);
    \spiral[black](6.86, 1.00)(0:1:-0.4);

    % connecting them
    \draw[black,line width=1pt] plot [smooth] coordinates {(7.18, 0.81) (7.26, 1) (7.4, 1.6) (7.43, 1.73) (7.48, 1.86)};
    \draw[black,line width=1pt] plot [smooth] coordinates {(6.46, 1) (6.37, 0.84) (6.28, 0.69) (6.16, 0.57) (6.01, 0.47) (5.89, 0.41) (5.64, 0.34)};
    \draw[black,line width=1pt] plot [smooth] coordinates {(8.6, 1.6) (8.64, 1.84) (8.69, 2.02) (8.77, 2.22)};

  \end{tikzpicture}

\end{document}
这就是我得到的

为了连接这两个螺旋,我将图片数字化并测量了一些坐标,然后使用这些坐标在它们之间画了线。但是,连接并不顺畅。
我知道这是个愚蠢的做法。任何关于更好做法的建议都深受欢迎!
答案1

我画了一条大曲线的草图;其中有一些常数,但你会看到,除了半径之外,你无法真正改变它们。
代码
\documentclass[11pt, border=.5cm]{standalone}
\usepackage{tikz}
\usetikzlibrary{math}

\begin{document}

\begin{tikzpicture}[evaluate={%
    \aini = 45;  % initial angle
    \aend = 19;  %
    \r = 3;  % radius
    \T = 1.5 +.12;  % f\defines the number of turnings of one branch
    \c = .8;
  }]
  \draw[gray!40] (-5, -5) grid (5, 5);
  \draw[red!30] (0, 0) circle (\r);

  \draw[black, ultra thick] (-\aini: 3*\r)
  to[out={180 -\aini}, in=-\aini+2] (\aini: \r);

  \draw[black, ultra thick, variable=\t, domain=0:\T, samples=200]
  plot (\t*360 +\aini: {\r*(1 -\c*\t/\T)})
  to[out=\aend, in=-\aini] (-\aini: 0);

  \draw[ultra thick, variable=\t, domain=0:\T, samples=200]
  plot (\t*360 +\aini +180: {\r*(1 -\c*\t/\T)})
  to[out={180 +\aend}, in={180 -\aini}] (180 -\aini: 0);

  \draw[ultra thick] (180 -\aini: 3*\r)
  to[out=-\aini+2, in={180 -\aini}] (\aini +180: \r);
\end{tikzpicture}
\end{document}