

我想制作一个核磁共振光谱图,现在我有这个:
\documentclass[border=1cm]{standalone}
\usepackage{tikz}
\usepackage{pgfplots}
\pgfplotsset{compat=newest}
\begin{document}
    \begin{tikzpicture}
    \begin{axis}[   scale only axis=true,
                    width=.8\textwidth,
                    height=.3\textwidth,
                    tick align=outside,
                    tick pos=left,
                    xmin=0, xmax=160,
                    ymin=0, ymax=100,
                    xticklabels={9,8,7,6,5,4,3,2,1,0},
                    yticklabels={0},
                    xlabel={PPM},
                    title={NMR Spectroscopy},
                    ]
        \addplot[black,domain=0:160] {8};
        \addplot+[ycomb,black,no markers] plot coordinates{
            (135,95)
                (136,45)
                (134,40)
                (110,47)
                (111,20)
                (109,42)
                (108,18)
                (40,19)
        };
        \node at (123,85) {\small $CH_3$};
        \node at (123,75) {\small \textsl{Triplet}};
        \node at (110,65) {\small $CH_2$};
        \node at (110,55) {\small \textsl{Quartet}};
        \node at (40,45) {\small $OH$};
        \node at (40,35) {\small \textsl{Singlet}};
    \end{axis}
    \end{tikzpicture}
\end{document}
它看起来像这样:

我想要的是这个:

我的问题是:
- 如何删除轴和“地面”之间的图?
- 如何删除 Y 轴上的刻度?
- 如何在 X 轴上的主坐标之间添加半个刻度?
答案1
这是获取光谱的一种方法stylized。
广告2:已经回答过了。
广告 3:minor x tick num=1,在两个主要刻度之间添加 1 个次要刻度
广告 1:更改ymin=-10,AND\addplot[black,domain=0:160] {0};
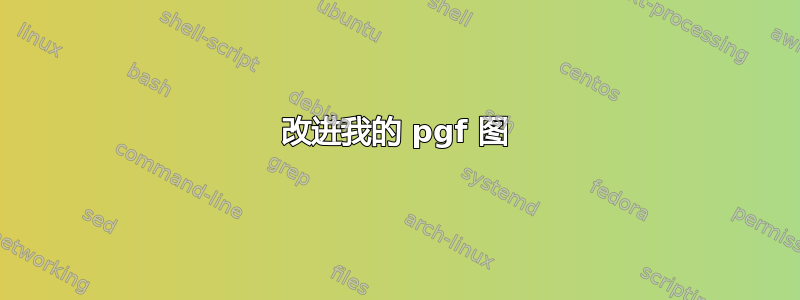
结果:

为了获得真正类似峰的结构,即狄拉克脉冲(衰减)与高斯(检测器)卷积,您需要计算并叠加(添加)几个高斯,在您的例子中是 8 个。为此:
使用正常的 xy 图,即不
\addplot[black,domain=0:160] {0};通过重写下面给出的方法进行计算,其中一个分量取振幅、x 位置,并有一个固定的非常小的 sigma
沿着这条路线
\pgfmathdeclarefunction{高斯}{3}{ \pgfmathparse{1/(#3平方根(2π)exp(-((#1-#2)^2)/(2#3^2))}%}
代码:
\documentclass[border=1cm]{standalone}
\usepackage{tikz}
\usepackage{pgfplots}
\pgfplotsset{compat=newest}
% ~~~~~~~~~~~~~~~~~~~~~~~~~~~
\begin{document}
    \begin{tikzpicture}
    \begin{axis}[   scale only axis=true,
                    width=.8\textwidth,
                    height=.3\textwidth,
                    tick align=outside,
                    tick pos=left,
                    xmin=0, xmax=160,
                    ymin=-10, ymax=100,                 % <<<
                    minor x tick num=1,                 % <<<
                    xticklabels={9,8,7,6,5,4,3,2,1,0},
                    yticklabels={0},
                    ytick style={draw=none},            % from comments
                    xlabel={PPM},
                    title={Stylized NMR Spectroscopy},  % <<<
                    ]
        \addplot[black,domain=0:160] {0};               % <<<
        \addplot+[ycomb,black,no markers] plot coordinates{
                (135,95)
                (136,45)
                (134,40)
                (110,47)
                (111,20)
                (109,42)
                (108,18)
                (40,19)
        };
        \node at (123,85) {\small $CH_3$};
        \node at (123,75) {\small \textsl{Triplet}};
        \node at (110,65) {\small $CH_2$};
        \node at (110,55) {\small \textsl{Quartet}};
        \node at (40,45) {\small $OH$};
        \node at (40,35) {\small \textsl{Singlet}};
    \end{axis}
    \end{tikzpicture}
\end{document}